
GCSE Economics – How Prices are Determined?
Demand for Goods and Services
Imagine you’re at an ice cream parlor on a scorching summer day. You’re given the choice to buy a scoop of ice cream for $5 or 2 scoops for $8. How many scoops would you choose? Most of us might be tempted to go for the 2 scoops. This simple scenario introduces us to the concept of demand, and how different prices can affect our purchasing decisions.
What is Demand?
At its core, demand refers to how much of something people want to buy at various prices. Using our ice cream example, if the parlor started offering 3 scoops for $10, some people might just demand even more! Simply put, it’s about the quantity of a good or service that consumers desire at different price points.
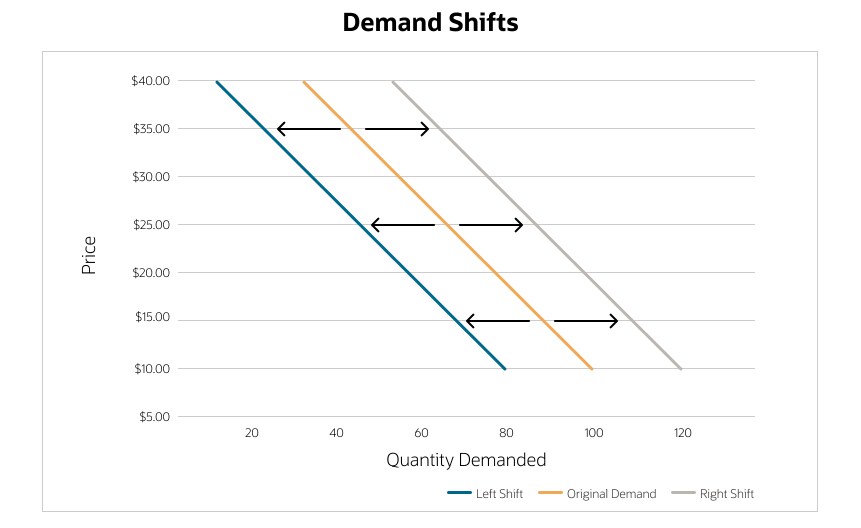
Demand Curve
Imagine a graph where the x-axis represents the quantity of ice cream scoops and the y-axis represents the price per scoop. Now, as the price per scoop drops, you’d likely buy more scoops, right? This relationship is illustrated by the demand curve, which typically slopes downward. As prices decrease, our demand usually goes up, and vice-versa.
The Twist: Shifts vs. Movements
When looking at this graph, there are two types of changes to keep an eye on:
1. Movement Along the Demand Curve
This is like our earlier ice cream example. If the price drops, you’ll slide along the curve to a point where you’re buying more. However, if the price rises (maybe due to a vanilla bean shortage), you might decide it’s too pricey and buy less, moving to a different point on the same curve.
2. Shift of the Demand Curve
Now, let’s say a new study claims ice cream helps improve memory. Suddenly, everyone wants more ice cream, regardless of the price! This means our entire demand curve shifts to the right, indicating an increased demand at every price level. On the flip side, if a rumor spreads that a particular brand of ice cream causes headaches, demand might plummet, causing the curve to shift left.
But Why Does Demand Change?
Several factors can influence our desire for a product:
- Tastes and Preferences: Just like how some of us might crave chocolate chip while others pine for pistachio.
- Income Levels: When people earn more, they might indulge in premium flavors or brands more often.
- Prices of Related Goods: If sorbets, an alternative to ice cream, become cheaper, some might switch over. On the other hand, if waffle cones get cheaper, more people might want to get scoops to fill those cones, increasing the demand for ice cream.
- Expectations of Future Prices: If you hear that ice cream prices will skyrocket next week, you might want to stock up now!
The beauty of demand lies in its ever-changing nature, influenced by a mix of personal choices, market dynamics, and external factors. So, the next time you’re deciding on the number of scoops, remember the economic principles at play behind that creamy delight!
Supply for Goods and Services
Picture this: It’s apple season, and the trees in Mr. Smith’s orchard are bursting with juicy red apples. Given the bounty, he’s considering selling them at the local market. The price he sets and the quantity he decides to sell are integral to the concept of supply. Let’s delve into this juicy topic!
What is Supply?
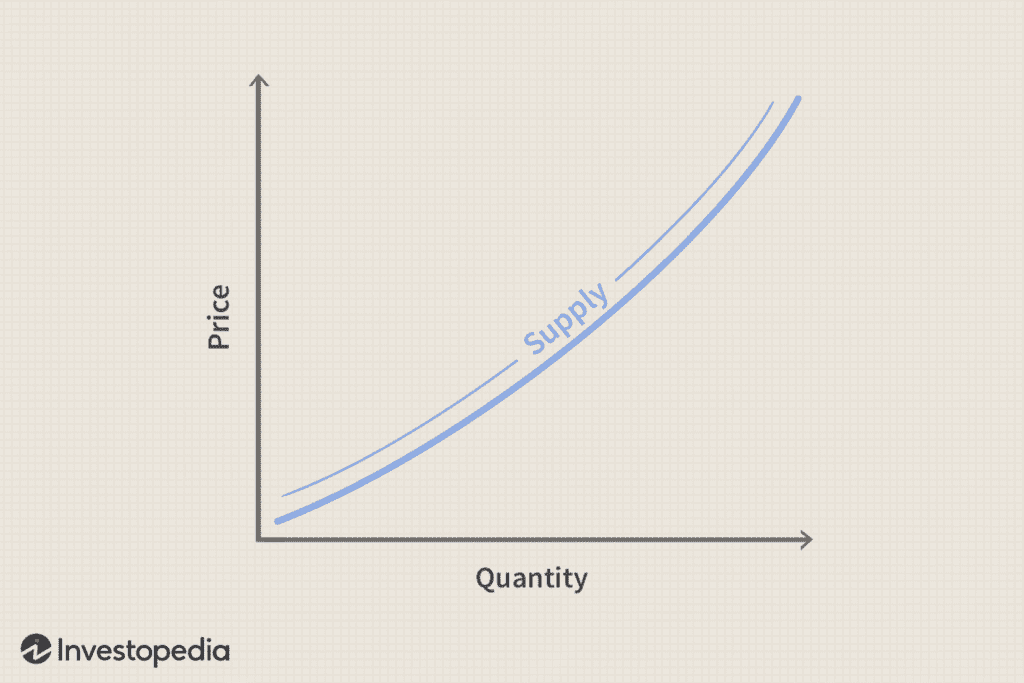
Supply is all about how much of something producers, like our apple-growing Mr. Smith, are willing to provide at various prices. If the market price for apples is high, Mr. Smith might decide to harvest and sell more apples. However, if the price drops too low, he might think it’s not worth the effort and will sell less.
Navigating the Supply Curve
Now, envision a graph. The x-axis represents the quantity of apples, and the y-axis denotes the price per apple. Typically, as the price rises, suppliers are more willing to produce and sell more of the item. Hence, the supply curve generally slopes upward. In our apple scenario, if the price per apple is high, Mr. Smith may even consider investing in more trees or better equipment to boost his supply.
Dynamics of Change: Shifts vs. Movements
When observing this graph, it’s important to distinguish between two types of changes:
1. Movement Along the Supply Curve
This happens when there’s a change in the price of the good itself. Let’s say there’s a sudden trend around apple pies, causing apple prices to soar. Mr. Smith will likely move along the curve to a point where he’s supplying more apples to capitalise on this trend.
2. Shift of the Supply Curve
Sometimes, factors other than the product’s price come into play. Imagine there’s a new fertiliser that can double the yield of apple trees. This innovation means Mr. Smith can supply more apples at every price point, causing the entire curve to shift right. Conversely, if a pest infestation threatens apple orchards, the curve might shift left, indicating a decreased supply.
Factors Driving Supply Changes
What makes suppliers like Mr. Smith decide to produce more or less?
- Production Costs: If the cost of fertiliser or labor rises, Mr. Smith might cut down on production, reducing his supply.
- Technological Innovations: A new apple-harvesting robot could boost Mr. Smith’s production capacity, increasing supply.
- Expectations: If Mr. Smith believes apple prices will drop next month, he might rush to sell more now.
- Number of Sellers: If more farmers start selling apples, the overall market supply will rise. But if some switch to growing oranges, the apple supply could decrease.
In essence, supply revolves around the decisions producers make, influenced by market prices and various external conditions. So the next time you bite into a crisp apple, remember the intricate dance of economics that brought it to your hand!
Equilibrium Price: Finding the Perfect Balance
Imagine a bustling marketplace where buyers and sellers haggle, each trying to get the best deal. Buyers want the lowest price, while sellers aim for the highest. Amidst this cacophony, there exists a magical price point where everything just… clicks. This sweet spot, where the amount of goods buyers want to purchase matches the quantity sellers want to provide, is the equilibrium price.
Understanding Equilibrium
At its core, the equilibrium price is like the Goldilocks zone in economics, neither too high nor too low. It’s the price where the quantity demanded by consumers equals the quantity supplied by producers. No shortages, no surpluses, just right.
The Meeting Point: Supply and Demand Diagram
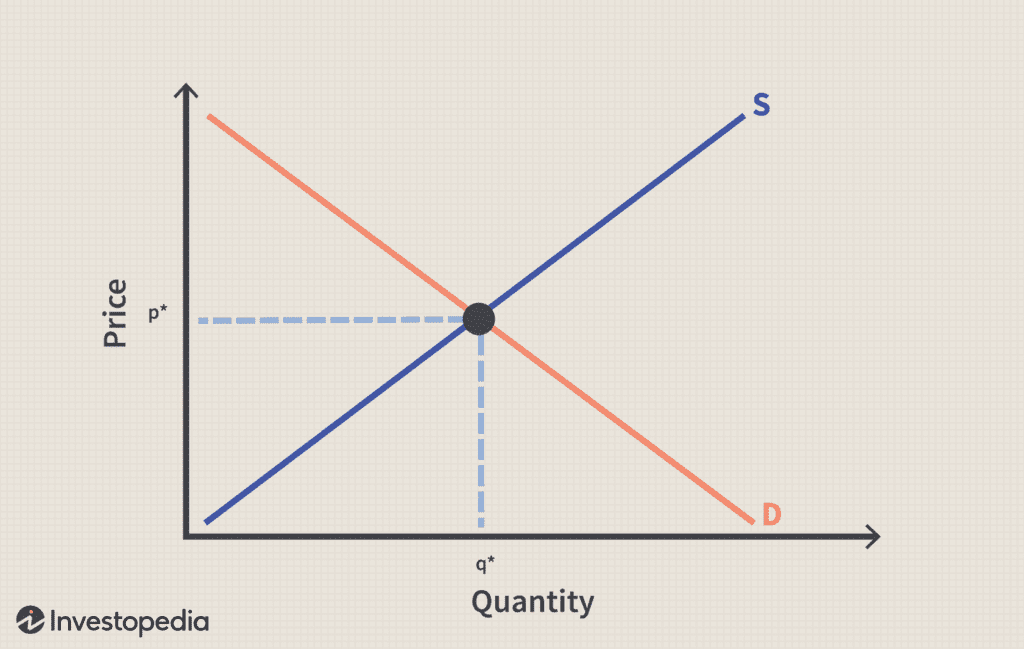
To visualise this, let’s return to our trusty supply and demand diagram. Plot the supply curve and the demand curve, then identify the point where they intersect. This intersection represents the equilibrium, with the equilibrium price and equilibrium quantity shown on the axes.
1. Excess Demand (Shortage)
If the price is set below the equilibrium price, the quantity demanded will exceed the quantity supplied. Think of a must-have toy during the holiday season priced too low; everyone wants one, but there aren’t enough to go around.
2. Excess Supply (Surplus)
Conversely, if the price is above the equilibrium, the quantity supplied will overshadow the quantity demanded. Consider a situation where a new type of soda is priced too high. Shelves might be stocked, but few are buying.
The Dance of the Market
Markets have a natural tendency to move towards equilibrium. When there’s a shortage, competition among buyers can drive the price up. When there’s a surplus, sellers might reduce prices to clear out inventory.
Applying It to the Real World
The concept isn’t just theoretical; it’s at play all around us. When a city faces a housing shortage, rent prices might soar. When there’s an abundance of fresh produce during a particular season, prices at your local grocery might drop.
The beauty of the equilibrium price is that it represents a state of balance in the marketplace, achieved naturally as buyers and sellers go about their business. So, the next time you find just the right deal, it might just be the market finding its equilibrium!

Intermarket Relationships: The Domino Effect in Economics
Imagine you’re setting up a line of dominos. You tap one, and a ripple effect ensues as each piece affects the next. Similarly, in the vast and interconnected marketplace, changes in one market can create ripples in another. This interconnected behavior is what we term as intermarket relationships.
Breaking It Down: Complements and Substitutes
In the world of goods and services, most items don’t exist in isolation. They relate to others in meaningful ways. Two primary types of relationships define how goods influence each other:
1. Complementary Goods
These are products that are typically used together. Think of peanut butter and jelly, or cars and petrol. If the price of one goes up, the demand for its complement might go down, and vice versa.
For instance, if petrol prices soar, people might reconsider that road trip they planned, reducing the demand for cars. Conversely, if electric car charging becomes cheaper and more widespread, we could see an uptick in electric car purchases.
2. Substitute Goods
These are products that can replace one another. Picture tea and coffee, or streaming services like Netflix and Hulu. A rise in the price of one could increase the demand for its substitute.
Imagine if the cost of coffee beans were to shoot up due to a global shortage. Coffee prices in cafes might rise, leading more people to opt for a cup of tea instead.
The Butterfly Effect in Markets
The interplay between different markets is intricate. A change in the demand, supply, or price in one market can have unforeseen consequences in another.
For instance, if there’s a sudden trend around almond milk lattes, it’s not just the coffee shops that feel the impact. Almond growers might see an uptick in demand, and dairy farmers might find a dip in the demand for regular milk.
Connecting the Dots
Intermarket relationships remind us of the vast web of connections in our economy. Every consumer choice, every shift in supply, and every price fluctuation can send ripples throughout various markets, affecting producers and consumers in sometimes unexpected ways.
The next time you switch from one brand to another or opt for a different product due to a price change, remember: you’re part of a vast and interconnected dance of markets, each influencing and being influenced by the other.
Price Elasticity: Stretching and Squeezing the Market
Ever stretched a rubber band? Some bands stretch easily, while others offer more resistance. In a similar vein, the concept of price elasticity gauges how responsive the quantity demanded or supplied is to a change in price. It tells us how ‘stretchy’ or ‘rigid’ the market’s reaction is.
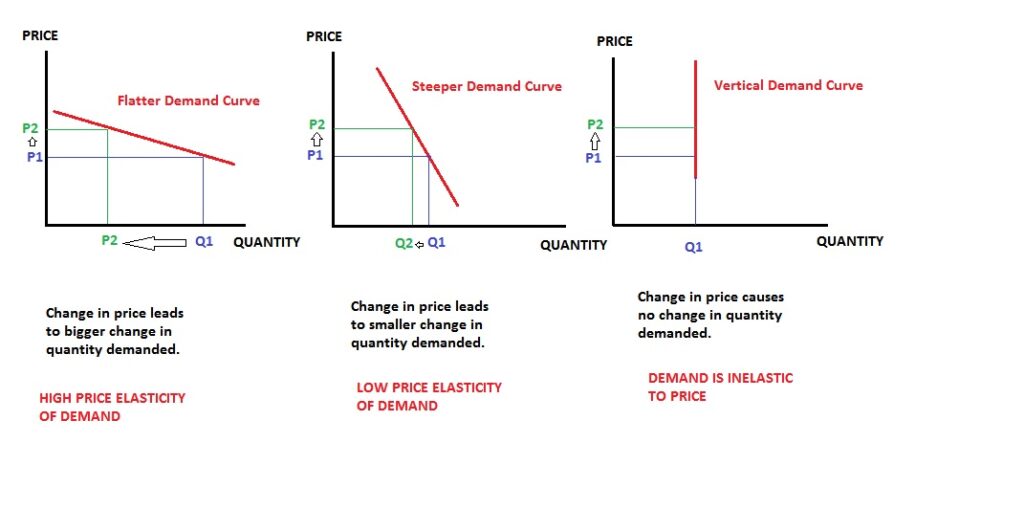
Diving into Price Elasticity of Demand (PED)
Price Elasticity of Demand (PED) measures how much the quantity demanded of a good responds to a change in its price. Here’s how it works:
1. Elastic Demand
Imagine the latest luxury smartphone’s price drops by just 5%. If the demand doubles because of this tiny price change, then the demand for this phone is elastic. It stretches easily with price changes.
2. Inelastic Demand
Now, think about life-saving medications. Even if their prices go up significantly, people still need them. A substantial price change might result in only a tiny dip in demand. This shows inelastic demand – it doesn’t change much with price.
Exploring Price Elasticity of Supply (PES)
Price Elasticity of Supply (PES) focuses on the producer side. It measures how the quantity supplied changes with price variations.
1. Elastic Supply
Consider handmade artisanal jewelry. If these items suddenly become trendy and their prices rise, artisans could increase production significantly to meet this demand, indicating elastic supply.
2. Inelastic Supply
Now picture a rare mineral used in specific tech devices. If demand surges and prices rise, it might still be challenging to quickly increase its extraction, signifying inelastic supply.
Calculating Elasticity
Elasticity is calculated as:
[ Elasticity = \frac{\text{Percentage change in quantity demanded or supplied}}{\text{Percentage change in price}} ]- If elasticity > 1, it’s elastic.
- If elasticity < 1, it’s inelastic.
- If elasticity = 1, it’s unit elastic.
Why Elasticity Matters
Elasticity is more than a fancy term; it has real-world implications:
- For Producers: Knowing the PED can help businesses set prices to maximise revenue. If a product has inelastic demand, they might consider raising prices. If it’s elastic, they’d tread carefully.
- For Consumers: Elasticities can impact spending. If fuel becomes more expensive and its demand is inelastic, families might need to adjust their budgets.
- For Policymakers: Understanding elasticity can inform tax policies and regulations. Sin taxes on cigarettes or alcohol, for example, are based on the inelastic nature of their demand.
In essence, price elasticity offers a window into the dance between price and quantity, highlighting how consumers and producers react to the ever-evolving rhythm of the market.
Consumer and Producer Surplus: The Bonus of the Marketplace
Picture this: You’re at a store, ready to buy your favorite book, and you’re willing to pay $20 for it. To your delight, it’s priced at just $15! That extra $5 you saved? That’s a taste of what economists call “consumer surplus.” On the flip side, imagine a farmer hoping to get $5 per kilo for apples and instead selling them for $7 per kilo. The additional $2 is what we term as “producer surplus.”
Understanding Consumer Surplus
Consumer Surplus is the difference between what consumers are willing to pay for a good or service and what they actually pay.
1. The Happiness Quotient
Let’s say you’re willing to pay up to $10 for a cinema ticket, but the price is only $7. Your consumer surplus is $3. It’s like an economic representation of the happiness or extra value you get from paying less than you expected!
2. In the Graphs
On a supply and demand graph, the consumer surplus is represented by the area between the demand curve and the price level, up to where it meets the supply curve.
Diving into Producer Surplus
Producer Surplus is the difference between the actual selling price and the lowest price a producer would have accepted for a good or service.
1. The Profit Bonus
Back to our apple farmer. If they expected to get $5 per kilo but instead received $7, the extra $2 per kilo is their producer surplus. It’s a bit like bonus profit!
2. Visualszing the Bonus
On our trusty supply and demand graph, producer surplus is the area between the supply curve and the set market price, ending where it intersects with the demand curve.
Why Do These Surpluses Matter?
Both surpluses indicate economic well-being.
- For the Market: A higher consumer and producer surplus means that the market is efficiently allocating resources, benefiting both buyers and sellers.
- For Policymakers: Changes in these surpluses can signal how policies, taxes, or regulations might impact well-being. For instance, a tax might reduce both consumer and producer surplus, indicating reduced market efficiency.
- For Businesses: Understanding consumer surplus can help businesses in pricing strategies. If they realise consumers are gaining a significant surplus, they might consider adjusting prices.
- For Consumers: Recognising the surplus concept can make consumers more aware of their spending choices and the value they derive from purchases.
In essence, consumer and producer surplus are like the cherry on top of the economic sundae. They give us insights into the extra benefits consumers and producers receive, painting a fuller picture of the market’s overall health and happiness.
Government Intervention in the Market: The Guiding Hand
Imagine playing a game where there are no rules, and players make up strategies on the fly. It could be fun, chaotic, or both. Markets, like games, can be unpredictable. This is where the government steps in, acting as a referee, setting rules, and sometimes intervening to ensure fairness and stability.
Why Governments Intervene
Markets are powerful mechanisms for allocating resources. However, they aren’t always perfect. Sometimes, they might fail to provide essential services or might operate in a way that’s harmful to society. Governments step in to:
- Correct Market Failures: This includes issues like monopolies that reduce competition or situations where public goods (like lighthouses or public defense) aren’t adequately provided by the private sector.
- Redistribute Income: Governments might aim for a more equitable distribution of wealth, using tools like progressive taxation or subsidies for lower-income households.
- Protect Consumers: Regulations can ensure products are safe, sellers are honest, and consumers are informed.
- Preserve the Environment: Governments can regulate or incentivise businesses to reduce pollution or conserve resources.
Tools of Intervention
1. Price Controls
Governments can set price ceilings (maximum prices) or price floors (minimum prices). For instance, rent controls might keep housing affordable, while minimum wage laws ensure workers earn a basic income.
2. Taxes and Subsidies
Governments can tax harmful products (like tobacco) to reduce their consumption or subsidise beneficial ones (like renewable energy) to promote their use.
3. Regulation
From health standards in food production to safety measures in cars, regulations set the rules of the game for producers.
4. Direct Provision
Sometimes, governments directly provide goods or services, like public education, healthcare, or defense.
5. Trade Barriers
Governments can use tariffs, quotas, or bans to control the flow of goods and services across borders, often to protect domestic industries.
The Balancing Act
Government intervention is a bit of a tightrope walk. Too little, and you might end up with markets that are harmful or unfair. Too much, and you risk stifling innovation, reducing efficiency, or creating unintended negative consequences.
Why It Matters
Understanding the role of government in markets isn’t just for economists or policymakers. It affects everyone:
- For Businesses: Regulations and taxes can influence operational costs, market opportunities, and competitive landscapes.
- For Consumers: Interventions can impact prices, quality, variety, and safety of products and services.
- For Society: Decisions about intervention touch on broader issues about the kind of society people want to live in—whether it prioritizes equity, efficiency, freedom, or a mix of these values.
In the grand market game, the government’s role as a referee is pivotal. While players (producers and consumers) drive the action, the rules set by the referee shape how the game unfolds, ensuring it’s played fairly and beneficially for the broader community.
Non-Price Determinants: Beyond the Price Tag
When you’re deciding what to buy, or when a company chooses how much to produce, is it all about the price? While price is a significant factor, numerous other elements, known as non-price determinants, influence these decisions. They’re like the unseen forces steering a ship, guiding both demand and supply beyond just the price tag.
Demand Side: Factors Influencing Buyer Decisions
1. Tastes and Preferences
Imagine superheroes suddenly becoming a global craze. The demand for superhero merchandise would skyrocket, not because they’ve become cheaper, but because they’re now ‘in’. Trends, advertising, and cultural shifts can all influence our preferences.
2. Income
If people’s incomes rise, they generally buy more of most goods. Think about finally getting that promotion and deciding it’s time for a newer, fancier car.
3. Prices of Related Goods
- Substitutes: When the price of tea rises, some might switch to coffee. These are substitute goods, and an increase in the price of one can increase demand for the other.
- Complements: If the price of printers drops, people might buy more ink cartridges. These are complementary goods; a price decrease in one can boost the demand for its complement.
4. Expectations
If you expect the price of a product to rise in the future, you might buy more of it now. The anticipated iPhone shortage? That’s why everyone’s rushing to buy one today!
5. Number of Buyers
More people mean more demand. A city with a booming population will see higher demand for housing, food, and services.
Supply Side: Factors Influencing Producer Decisions
1. Production Costs
If the cost of producing laptops falls thanks to a new technology, manufacturers might supply more laptops at each price point.
2. Technology
Advancements can make production more efficient, leading to an increase in supply. Think of how modern farming techniques have revolutionised agriculture.
3. Prices of Related Goods in Production
Farmers might shift from growing barley to wheat if wheat prices soar. Here, barley and wheat are related goods in production.
4. Expectations
If a toy manufacturer expects a particular toy to be the season’s hottest sell, they might increase its production in anticipation.
5. Number of Sellers
More sellers in the market typically mean more supply. The explosion of indie game developers has broadened the supply of video games available.
6. Natural Events or External Shocks
A drought can significantly reduce the supply of agricultural products, while a sudden discovery of a mineral deposit can increase the supply of that mineral.
Why These Determinants Matter
Understanding non-price determinants helps in decoding the complexities of the market. It offers insights into why prices might be rising or falling and predicts future trends.
- For Businesses: Recognising these factors can aid in making strategic decisions about production, marketing, and pricing.
- For Consumers: It’s valuable to understand market shifts, especially when considering significant investments or understanding living costs.
In the intricate dance of the market, non-price determinants are the rhythm and beats guiding the moves of buyers and sellers. They remind us that while price is crucial, it’s just one player in a cast of characters shaping the market story.
Market Structures and Pricing: Navigating the Marketplace
Ever walked into a bustling bazaar filled with hundreds of stalls, each selling unique items and setting their own prices? Contrast that with a small town where one large supermarket dictates what’s available and at what cost. The dynamics of these two scenarios differ, reflecting the different market structures in the world of economics.
Types of Market Structures
1. Perfect Competition
Imagine a market with numerous small sellers, all selling identical products—like a vast field of wheat farmers. Here:
- Pricing: Prices are determined by market demand and supply. Individual sellers are “price takers”, accepting the going rate.
- Characteristics: Many sellers, identical products, free entry and exit, and perfect information among buyers and sellers.
- Example: Agricultural markets, where individual farmers don’t have much sway over the market price of crops.
2. Monopolistic Competition
Picture a bustling high street filled with restaurants. Each offers food, but there’s a variety in cuisine, ambiance, and pricing.
- Pricing: Sellers have some control over prices because their products are differentiated, but competition limits this power.
- Characteristics: Many sellers, differentiated products (through branding, quality, etc.), free entry and exit.
- Example: The fast-food industry, where each brand tries to differentiate itself from competitors.
3. Oligopoly
Imagine a market dominated by a few big players, like the smartphone industry.
- Pricing: Pricing is more strategic, as firms are highly interdependent. A pricing decision by one firm can lead to reactions from competitors.
- Characteristics: Few dominant sellers, barriers to entry, products can be similar or differentiated.
- Example: The commercial airline industry in many countries.
4. Monopoly
This is a market ruled by one big player. Think of a utility company providing electricity to a city.
- Pricing: The monopolist sets the price. It has significant power but is often regulated by governments to prevent consumer exploitation.
- Characteristics: One seller, unique product with no close substitutes, significant barriers to entry.
- Example: Utility companies in regions where they’re the sole providers.
Why Market Structures Matter
Consumer Perspective
- Variety and Pricing: In monopolistic competition, consumers get variety. In pure monopolies, less so.
- Innovation and Quality: Competitive markets often drive innovation. Monopolies might not have the same incentive.
Business Perspective
- Pricing Power: Firms in a monopoly or oligopoly have more power to set prices than those in perfect competition.
- Strategic Decisions: Businesses in oligopolistic markets need to consider competitors’ reactions when making decisions.
Government Perspective
- Regulation: Monopolies, due to their pricing power, are often regulated to ensure consumer interests are protected.
The Grand Takeaway
Market structures, from the lively bazaar of perfect competition to the singular large store of monopoly, shape how prices are set, what’s available, and the overall dynamics of the marketplace. For anyone navigating the economic seas, understanding these structures is akin to having a trusty compass, guiding decisions and strategies.
Speculation and Bubbles: Riding the Economic Rollercoaster
You’ve probably heard tales of folks making (or losing!) fortunes overnight in stock markets, or perhaps of housing prices skyrocketing only to crash spectacularly. At the heart of these stories are two concepts: speculation and economic bubbles. Let’s embark on a journey to understand these intriguing phenomena.
Speculation: Gazing into the Economic Crystal Ball
Speculation involves buying assets, like stocks, property, or commodities, with the hope of selling them at a higher price in the future. But it’s not just simple buying and selling; it’s characterised by:
- Risk: Speculators often make decisions based on price predictions rather than the inherent value of an asset.
- Short-Term Focus: Unlike investors who might buy stocks for dividends or long-term growth, speculators often seek quick returns.
Example: Imagine overhearing rumors that a certain tech company will launch a groundbreaking product soon. Betting on this, you buy shares of this company, hoping to sell them for a hefty profit post-launch.
Economic Bubbles: When Exuberance Clouds Judgment
A bubble occurs when the price of an asset, be it stocks, real estate, or tulips (yes, tulips!), rises far above its intrinsic value. This typically happens because of:
- Excessive Speculation: If everyone believes prices will keep rising, they’ll keep buying, pushing prices even higher.
- Irrational Exuberance: Over-enthusiasm or over-optimism about asset prices can lead to a bubble. People tend to believe “this time it’s different!”
- Easy Access to Credit: If borrowing is easy, people might take on significant debt to speculate, exacerbating the bubble.
Example: Recall the infamous Tulip Mania in 17th-century Holland. Tulip bulb prices soared as everyone wanted a piece of the action. At its peak, some bulbs were valued more than houses! But eventually, reality struck, the bubble burst, and prices plummeted.
The Pop: When Bubbles Burst
No bubble lasts forever. When the realisation sets in that asset prices are unsustainably high, a rush to sell ensues, leading to rapid price declines.
- Consequences: Bursting bubbles can lead to financial crises, lost fortunes, and prolonged economic downturns.
- Historical Examples: Beyond Tulip Mania, the 2008 housing crisis is a more recent instance where excessive speculation in real estate led to a devastating bubble burst.
Guarding Against the Hype
While the allure of quick riches can be tempting, it’s essential to remain grounded. Here are a couple of pointers:
- Research: Before diving into an investment, understand the asset and its inherent value.
- Diversify: Spread your investments to reduce risk. Don’t put all your eggs in one speculative basket.
In Conclusion
Speculation and bubbles have been a part of economic history for centuries. They serve as cautionary tales, reminding us of the perils of following the herd blindly and the importance of informed decision-making. So the next time you hear of the next big thing that “can’t fail”, remember the tulips and tread carefully!
Factors Affecting Elasticity: The Stretchy Side of Economics
Elasticity, in the world of economics, gauges how much one variable responds to a change in another variable. Imagine a rubber band: how much it stretches (or doesn’t) can be likened to elasticity in economic terms. Now, let’s zoom in on the factors that affect this stretchiness, particularly for price elasticity of demand and supply.
Factors Influencing Price Elasticity of Demand (PED)
PED measures the responsiveness of quantity demanded of a product to its price change. The following factors determine how stretchy this demand can be:
1. Availability of Substitutes
- Logic: The more substitutes available, the more elastic the demand. If the price of one brand of coffee rises, and there are plenty of alternatives, consumers can easily switch.
- Example: Let’s say the price of Pepsi surges. If Coca-Cola is readily available and similarly priced, many might just opt for Coke.
2. Necessity vs. Luxury
- Logic: Demand for necessities tends to be inelastic because people need them regardless of price fluctuations. Luxuries, on the other hand, have more elastic demand.
- Example: Insulin for diabetics is a necessity, while a designer handbag is a luxury.
3. Time Period
- Logic: Demand elasticity can change over time. In the short term, demand might be inelastic, but given more time, consumers might find alternatives.
- Example: If gasoline prices shoot up, people might continue driving their cars initially, but over time, they might consider public transport or carpooling.
4. Habitual Consumption
- Logic: Products that are habitually consumed, like cigarettes for some, tend to have inelastic demand.
- Example: Even if cigarette prices rise, addicted smokers might continue to purchase them.
Factors Influencing Price Elasticity of Supply (PES)
PES captures the responsiveness of quantity supplied to a change in price. Here’s what influences its elasticity:
1. Time and Production Speed
- Logic: In the short term, if a product takes a long time to produce, its supply will be inelastic. Over the longer term, producers can adjust, making supply more elastic.
- Example: While it’s challenging to ramp up the production of wine immediately after a price increase (due to the aging process), manufacturers of plastic toys can increase their output relatively quickly.
2. Storage Possibilities
- Logic: Products that can be stored without spoiling will have a more elastic supply since producers can stock up when prices are low and release these stocks when prices rise.
- Example: Non-perishable goods like canned foods versus perishables like fresh fruits.
3. Spare Capacity
- Logic: If a producer has unused capacity, they can increase output without significant additional costs, leading to more elastic supply.
- Example: A factory operating at half its capacity can increase production if the product’s price goes up, without needing a new factory.
Test Yourself – GCSE Economics – How Prices are Determined?
Which of the following would cause a movement along the demand curve? a) Change in consumers' income b) Change in the price of the good c) Introduction of a substitute product d) Change in consumer tastes
b) Change in the price of the good
When does a market experience excess demand? a) When quantity demanded is less than quantity supplied b) When quantity demanded equals quantity supplied c) When quantity demanded is greater than quantity supplied d) When the market is in perfect competition
c) When quantity demanded is greater than quantity supplied
What does the concept of "price elasticity of supply" measure? a) The responsiveness of quantity demanded to a change in price b) The percentage change in quantity supplied to a change in its price c) The total revenue a firm receives d) The difference between marginal cost and marginal revenue
b) The percentage change in quantity supplied to a change in its price
If two goods are complements, what's likely to happen if the price of one of the goods increases? a) The demand for the other good increases b) The demand for the other good remains unaffected c) The demand for the other good decreases d) The supply for the other good decreases
c) The demand for the other good decreases
In which market structure would you find only one supplier with significant market power? a) Perfect competition b) Monopolistic competition c) Oligopoly d) Monopoly
d) Monopoly
What happens in an economic bubble? a) Asset prices fall rapidly due to oversupply b) Asset prices rise above their intrinsic value due to excessive speculation c) Asset prices remain stable over a long period d) Asset prices decrease gradually due to lack of interest
b) Asset prices rise above their intrinsic value due to excessive speculation
Which factor does NOT influence the price elasticity of demand? a) Availability of substitutes b) Nature of the good (luxury vs. necessity) c) Historical prices of the product d) Time period
c) Historical prices of the product
What is the primary reason governments intervene in markets? a) To speculate and make profits b) To ensure economic bubbles c) To correct market failures and achieve economic objectives d) To compete with other firms
c) To correct market failures and achieve economic objectives
When the price of a product rises and its demand is price inelastic, what happens to total revenue? a) It decreases b) It remains unchanged c) It increases d) It becomes zero
c) It increases

Early Signs of Dyslexia in Kids and When to Get Help


